Case Study #2
 The subject church was assigned a Benchmark Budget repair fund target of $67,000. Donors contributed $68,000 for Year 1. The donor group met with staff and volunteers involved in the targeted ministries. Staff turnover was substantial throughout the course of the Benchmark Project. The following positions experienced turnover:
- Senior Pastor
- Associate Pastor
- Director of Children’s Ministry
- Director of Youth Ministry
- Director of College Ministry
- Choir Director
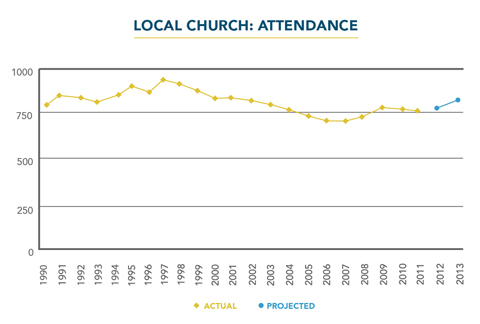
The consequences of the staff turnover was largely observed in worship attendance among college students. Between 2012 and 2015 average worship attendance decreased from 729 to 545 — a decrease of 25.2%. In contrast, giving to the operating budget increased over this period by 3.7%.
Church leaders, with the expectation of increasing worship attendance between 2012 and 2015, began significant inquiries and examinations of what was not working. As a consequence, the committee structure of the church was changed with new leadership selected in key positions. Between 2013 and 2015, the annual decline in worship attendance began to slow, and positive growth in worship attendance was recorded in January and February 2016. Giving to the operating budget in both January and February 2016 set new records. A new program for college students and members was started in 2014, and the leadership contracted with Colinasway in 2015 to conduct an 18-month visioning/discernment process.
In summary, the decline in worship attendance occurred in the absence of any church conflict or controversy. Upon examination, leaders discovered that some key committees of the church (e.g., evangelism) had not been operational for two years. Many other committees had not met regularly and had accomplished little when they did meet. Benchmark provided the inspiration to change things for the better. Laity involvement increased in may key areas of the church. Donor involvement in the life of the church was also one of the tremendous successes of the project.